Chapter 5: Go Garbage Collector - How Go Cleans Up After Your Code
Introduction
Your Go service starts with 100MB of memory. A week later, it consumes 4GB. Nothing changed in the code. Memory profiling shows minimal heap usage, yet memory keeps growing. Users complain about sluggish responses. Your monitoring alerts fire. You restart the service daily as a band-aid.
This scenario haunts many developers who don't understand Go's garbage collector. The GC isn't broken it's doing exactly what it's designed to do. You're simply not speaking its language.
Understanding the garbage collector transforms you from someone who fights memory management into someone who works with it. This chapter pulls back the curtain on one of Go's most sophisticated systems.
Why garbage collection knowledge matters:
- Performance optimization: Reducing GC overhead can cut response latency significantly
- Resource planning: Understanding memory behavior enables accurate capacity planning
- Debugging memory issues: Diagnosing leaks and bloat requires GC understanding
- Writing efficient code: GC-friendly patterns prevent unnecessary work
Core Concepts
Go blog diagram 1
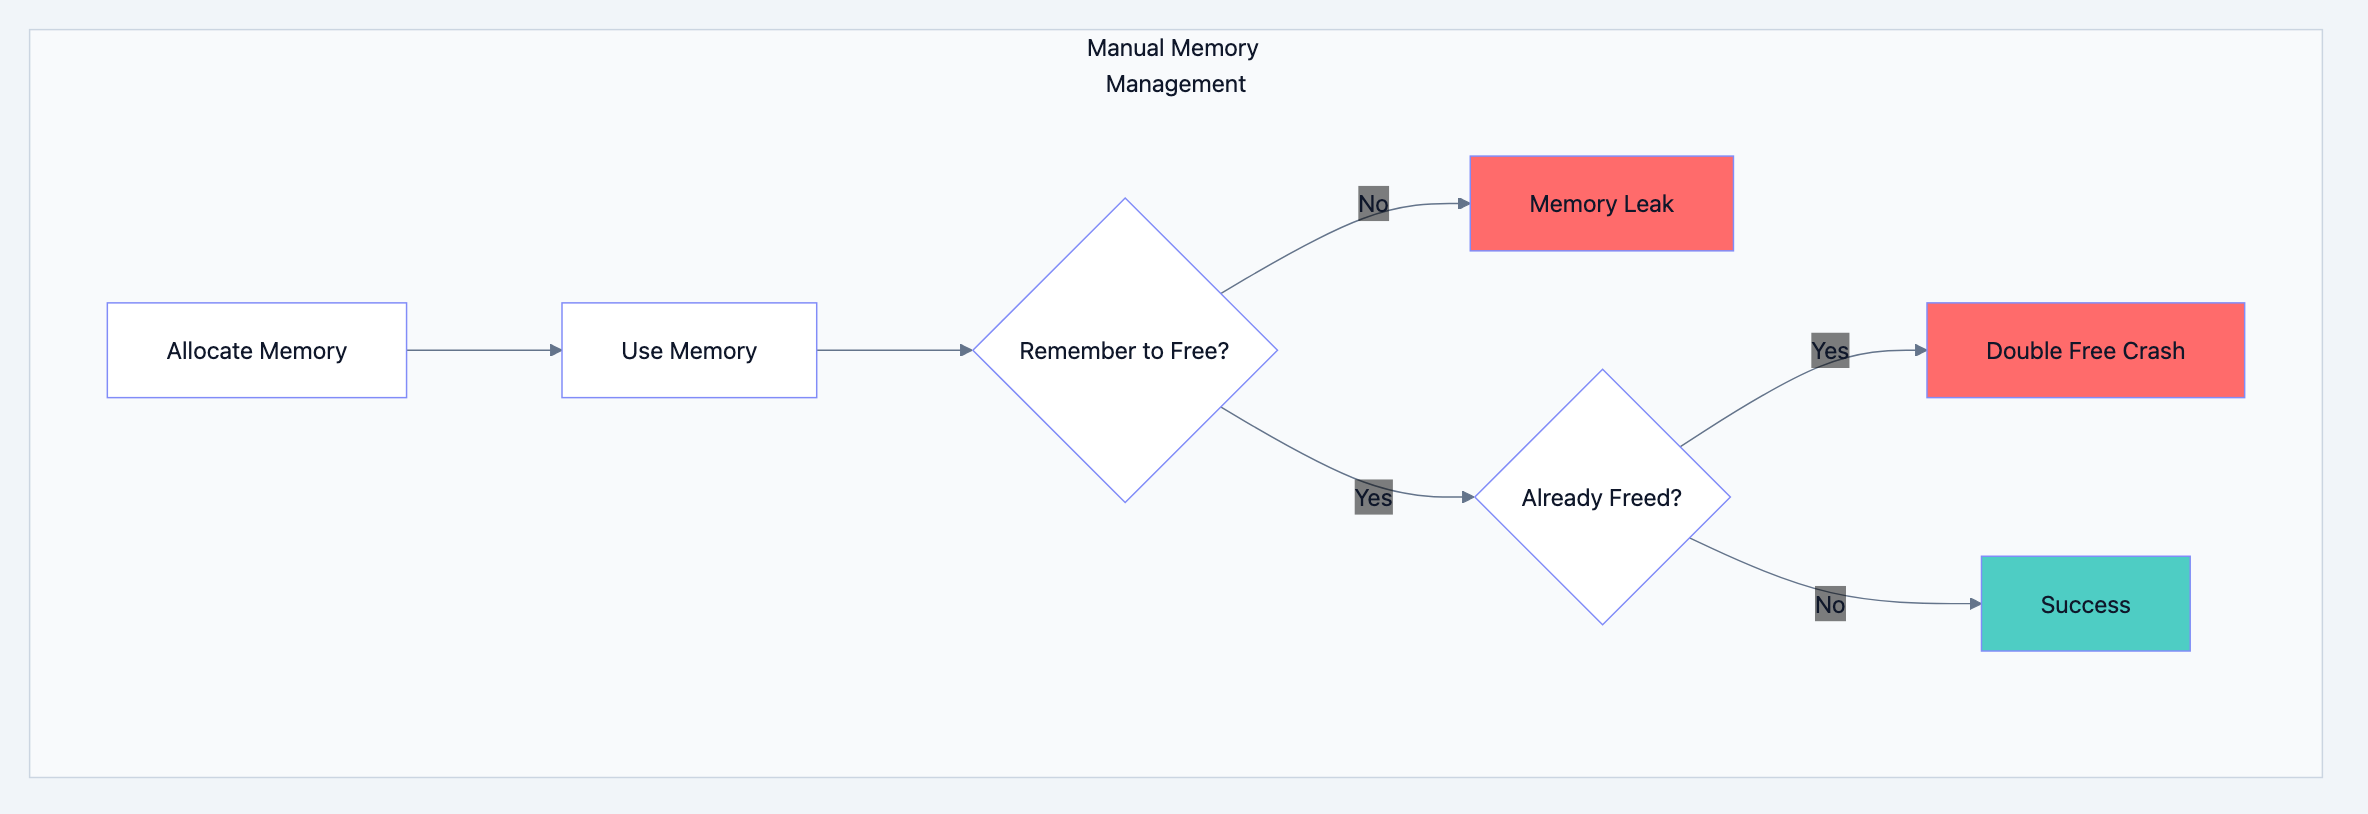
The Manual Memory Management Problem
In languages like C, you manage memory explicitly:
cchar* buffer = malloc(1024);  // Allocate
// ... use buffer ...
free(buffer);                  // You must remember to free!
buffer = NULL;                 // Prevent use-after-free (hopefully)
This approach leads to:
- Memory leaks: Forgetting to free allocated memory
- Double-free bugs: Freeing the same memory twice (crash/corruption)
- Use-after-free: Using memory after freeing it (security vulnerability)
- Dangling pointers: References to freed memory
These bugs are notoriously difficult to find and fix. Entire categories of security vulnerabilities stem from manual memory management errors.
Go's Automatic Approach
Go blog diagram 2
Go eliminates these problems through automatic garbage collection:
gofunc process() {
    data := make([]byte, 1024)  // Allocate
    // ... use data ...
    // No need to free! GC handles it when data is no longer reachable
}
The garbage collector automatically:
- Tracks all allocated memory
- Determines which allocations are still reachable
- Reclaims unreachable memory for reuse
You allocate; you forget. The GC figures out when memory is safe to reclaim.
The Cleaning Crew Analogy
Think of Go's garbage collector as a cleaning crew in an office building:
- The crew doesn't enter occupied offices (goroutines actively using memory)
- They identify empty offices (unreachable memory)
- They clean empty offices during work hours (concurrent collection)
- Work continues uninterrupted in occupied offices (low pause times)
- The crew coordinates to avoid disrupting workers (sophisticated scheduling)
This "concurrent" approach garbage collection happening alongside program execution is Go's key innovation.
Detailed Explanation: The Tricolor Algorithm
Go blog diagram 3
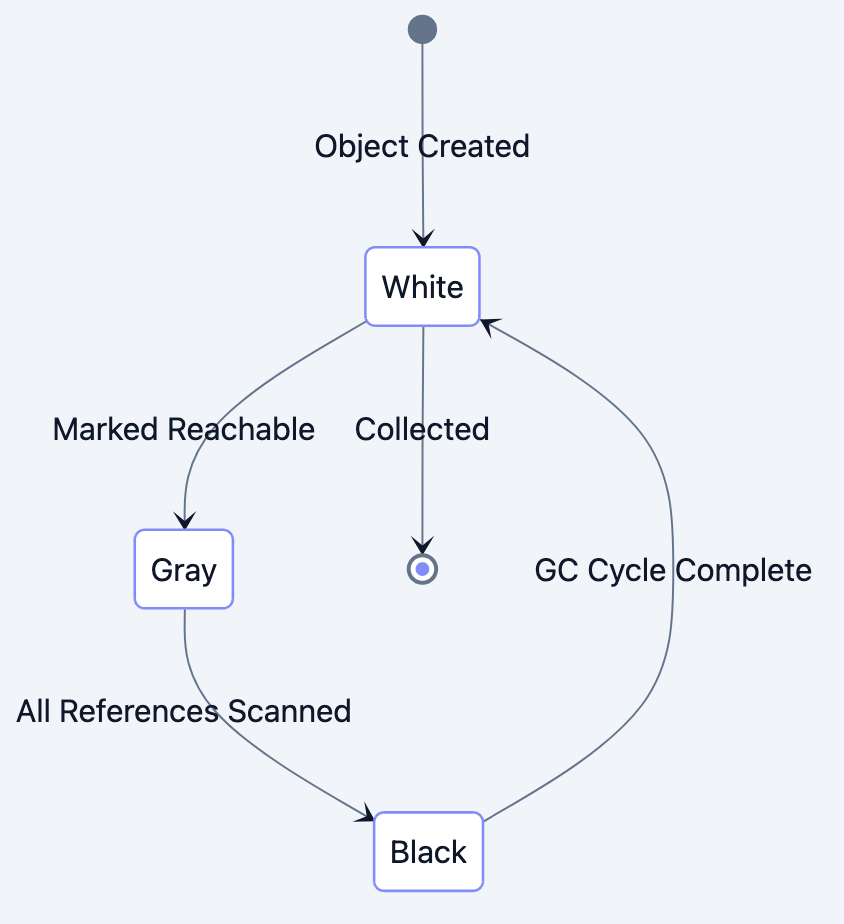
The Three Colors
Go uses a tricolor mark-and-sweep algorithm. Every object in memory is conceptually assigned one of three colors:
| Color | Meaning | State |
|---|---|---|
| White | Unknown/potentially garbage | Not yet examined |
| Gray | In progress | Reachable, but references not yet scanned |
| Black | Complete | Reachable, all references scanned |
At the end of collection, white objects are garbage; black objects are live.
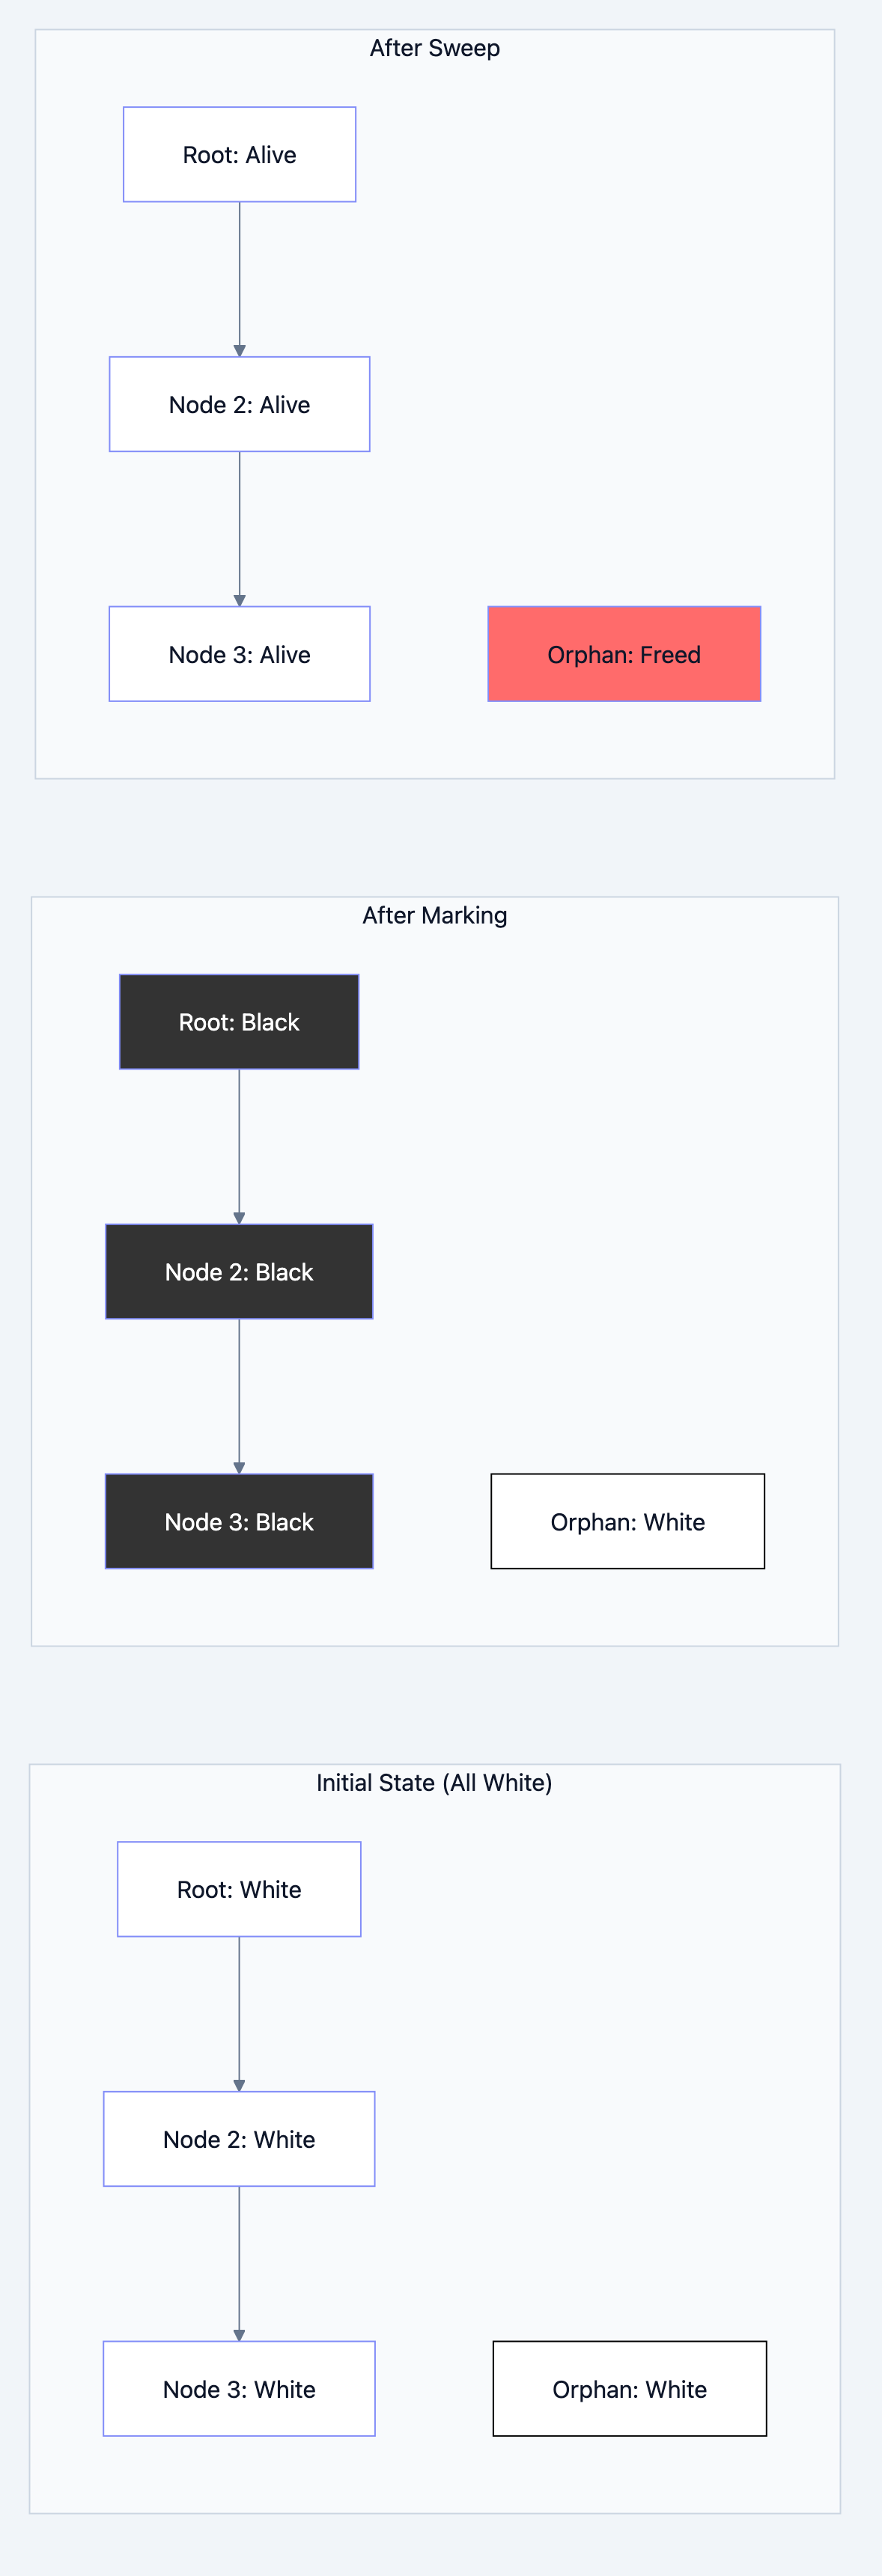
The Algorithm Step by Step
Go blog diagram 4
Phase 1: Initialize
All objects start as white. Root set (stack variables, globals) are colored gray.
Phase 2: Mark (Concurrent)
While gray objects exist:
- Take a gray object
- Scan its references, coloring referenced white objects gray
- Color the original object black
Phase 3: Sweep (Concurrent)
Reclaim all white objects they're unreachable.
go// Filename: gc_concept.go
package main

// Visualizing the algorithm with a linked list

type Node struct {
    Value int
    Next  *Node
}

func main() {
    // Build a chain
    root := &Node{Value: 1}           // Initially white
    root.Next = &Node{Value: 2}       // Initially white
    root.Next.Next = &Node{Value: 3}  // Initially white

    // This node has no reference from root
    orphan := &Node{Value: 999}       // Initially white
    _ = orphan                        // Compiler satisfaction

    // When GC runs:
    // 1. root → gray (reachable from stack)
    // 2. root → black, root.Next → gray
    // 3. root.Next → black, root.Next.Next → gray
    // 4. root.Next.Next → black
    // 5. orphan remains white (unreachable)
    // 6. Sweep: orphan's memory reclaimed
}
Why Tricolor Works Concurrently
Go blog diagram 5
The key insight: while the GC scans, your program keeps running and modifying references. The tricolor invariant maintains correctness:
Invariant: A black object never points directly to a white object.
If your program creates such a reference while GC is running, Go uses a write barrier a small piece of code that runs on pointer writes to maintain the invariant by coloring objects appropriately.
Detailed Explanation: GC Phases
Go blog diagram 6
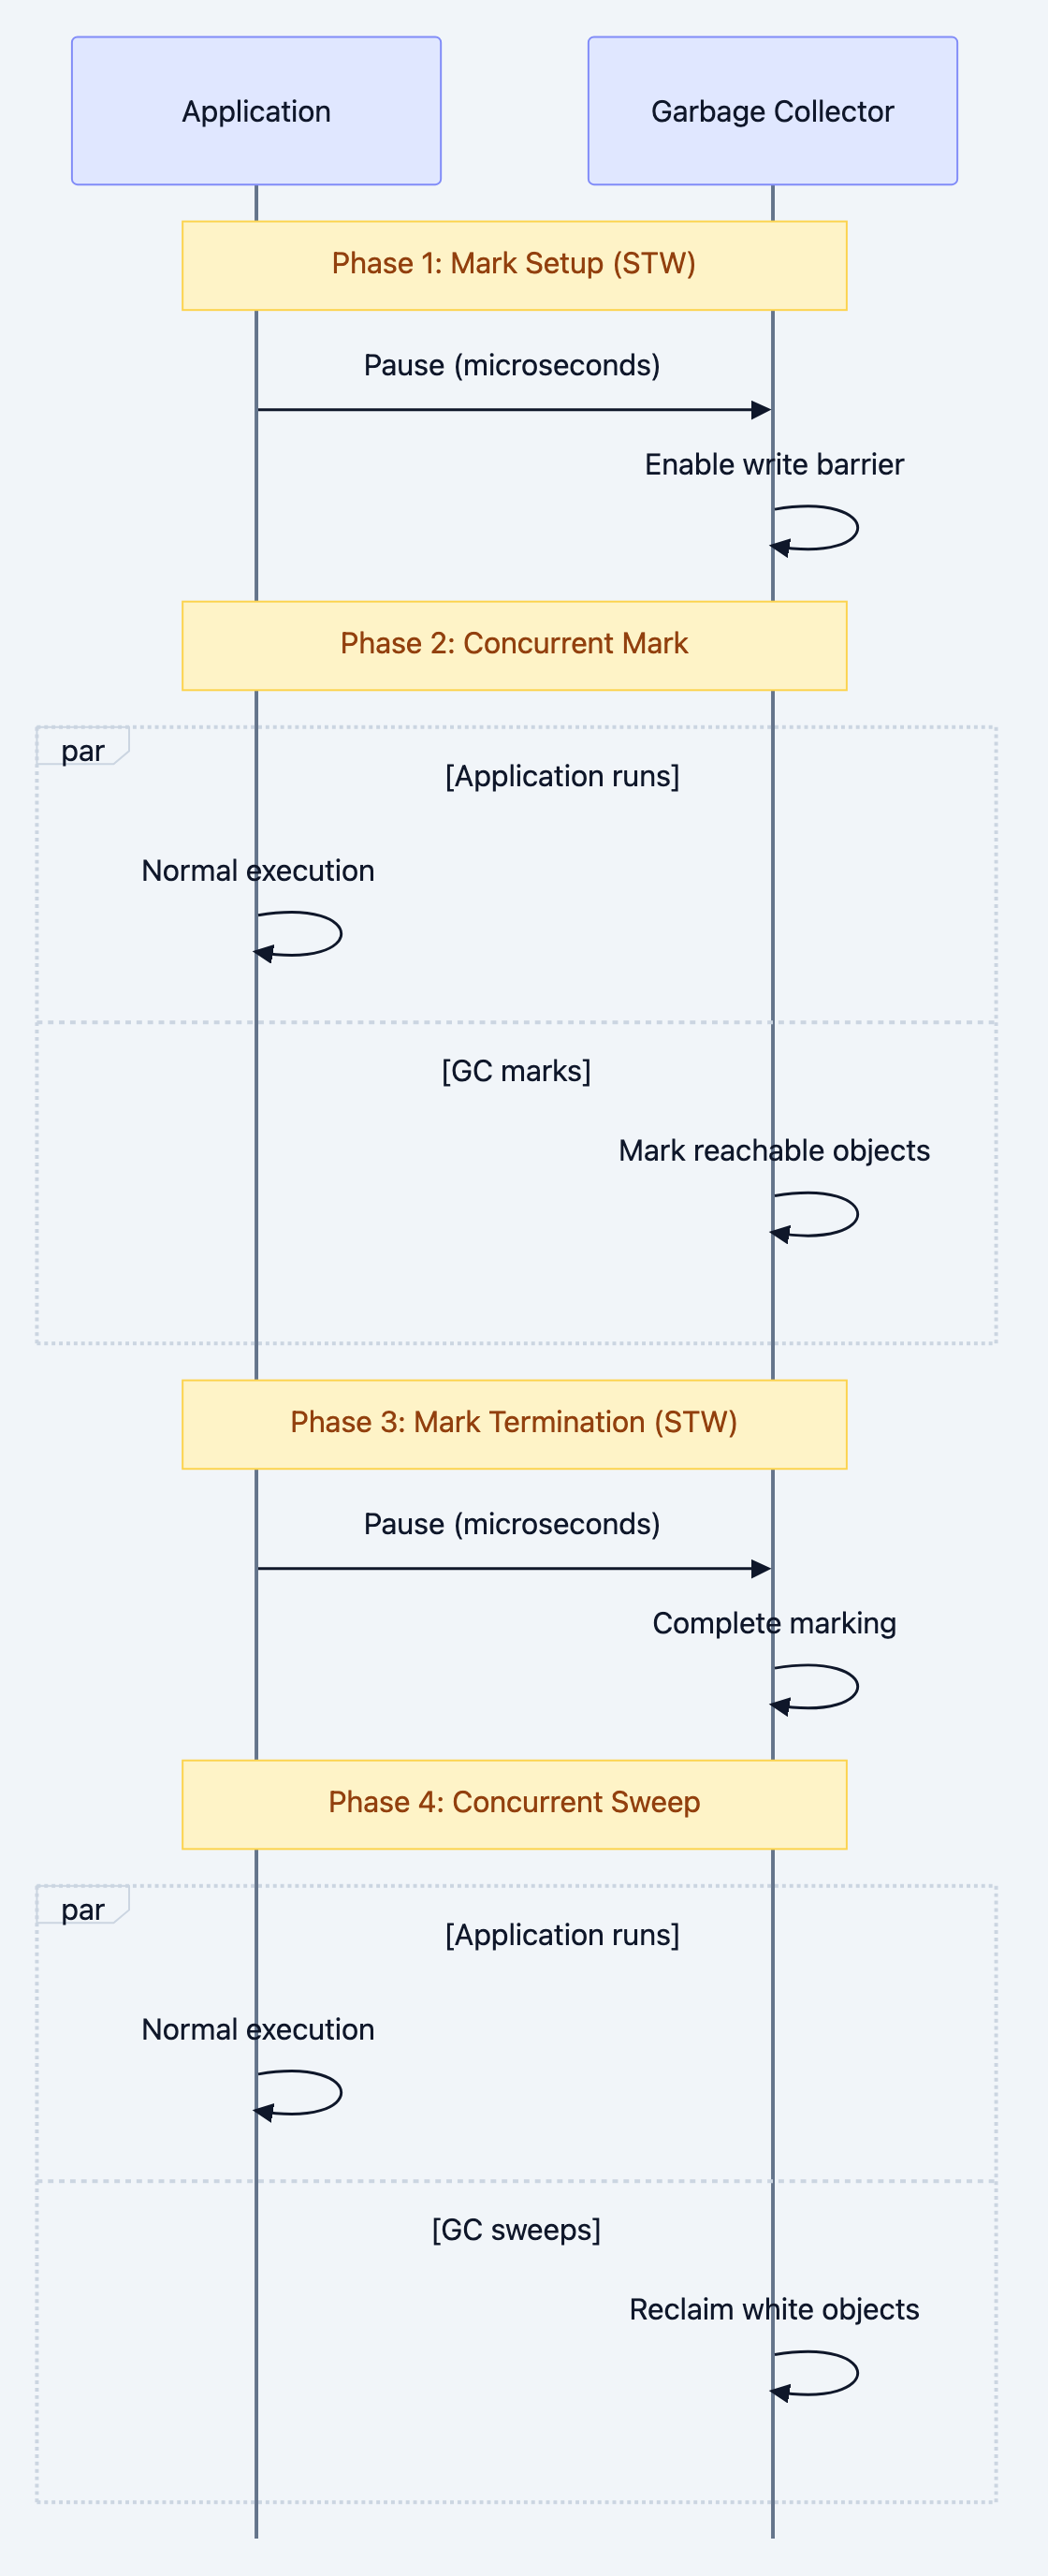
Phase Breakdown
Go's GC operates in distinct phases:
1. Mark Setup (Stop-the-World)
- Brief pause to prepare for marking
- Enable write barriers
- Typically microseconds
2. Concurrent Marking
- GC goroutines scan the heap alongside application goroutines
- Uses ~25% of available CPU by default (configurable)
- Application continues running
3. Mark Termination (Stop-the-World)
- Brief pause to finish marking
- Handle objects modified during concurrent marking
- Disable write barriers
4. Concurrent Sweeping
- Reclaim white objects
- Entirely concurrent with application
- Memory becomes available for new allocations
Visualizing the Phases
Application: |=====|  |========================================|  |=====|
             executing  executing (with write barrier)          executing

GC Work:          |STW|  |-------- concurrent mark -----------|  |STW|  |sweep|
                   1ms                 varies                     0.5ms  varies

Timeline:    --------------------------------------------------------------------->
The stop-the-world (STW) pauses are typically under 1 millisecond in modern Go, regardless of heap size.
Detailed Explanation: Tuning Parameters
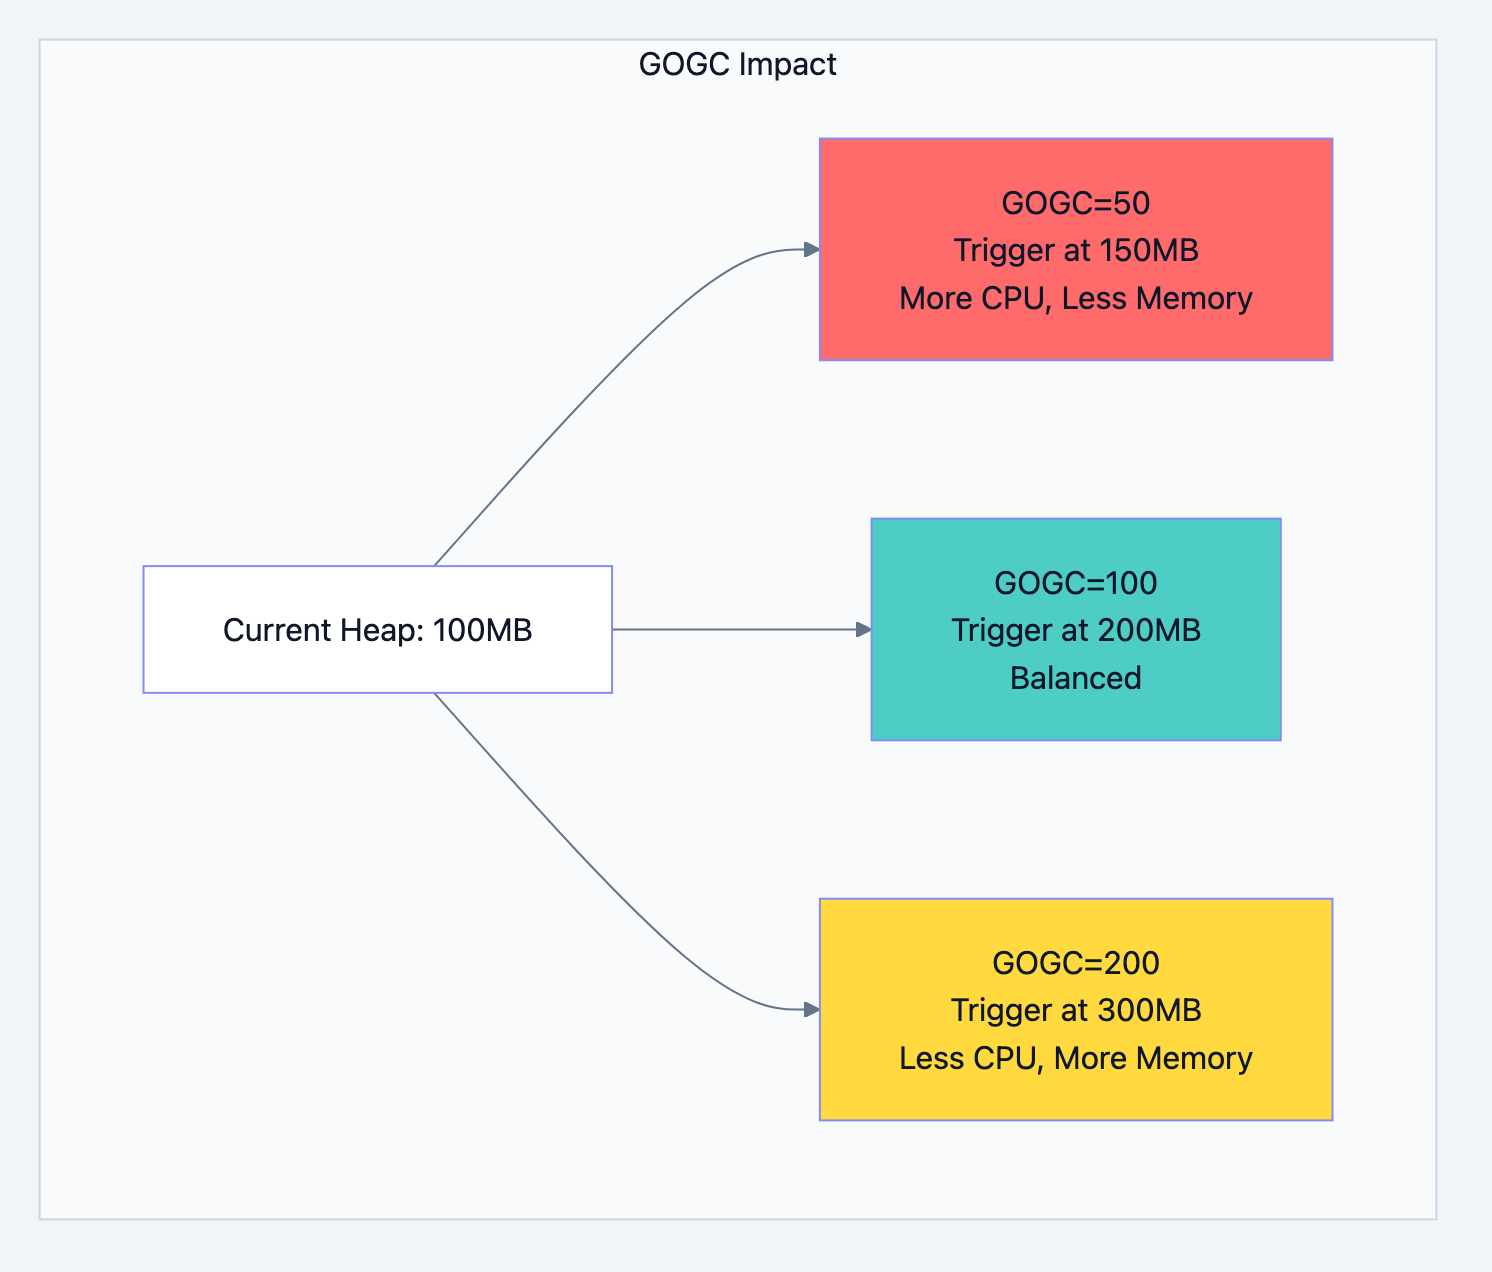
GOGC: Controlling Collection Frequency
GOGC (Go Garbage Collection) controls how often GC runs. The default is 100, meaning GC triggers when the heap doubles since the last collection.Current heap: 100MB GOGC = 100 → GC triggers at 200MB (100% growth) GOGC = 50 → GC triggers at 150MB (50% growth) GOGC = 200 → GC triggers at 300MB (200% growth) GOGC = off → GC disabled (dangerous!)
Trade-offs:
| Lower GOGC | Higher GOGC |
|---|---|
| More frequent GC | Less frequent GC |
| Lower memory usage | Higher memory usage |
| More CPU spent on GC | Less CPU spent on GC |
| Shorter individual pauses | Longer individual pauses |
go// Filename: gogc_example.go
package main

import (
    "fmt"
    "runtime"
    "runtime/debug"
)

func main() {
    // Check current setting
    current := debug.SetGCPercent(100)  // Set to 100, returns previous
    fmt.Printf("Previous GOGC: %d\n", current)

    // Set new value
    debug.SetGCPercent(50)  // More frequent GC

    // Read memory stats
    var stats runtime.MemStats
    runtime.ReadMemStats(&stats)

    fmt.Printf("Heap Allocated: %d MB\n", stats.HeapAlloc/1024/1024)
    fmt.Printf("GC Cycles: %d\n", stats.NumGC)
    fmt.Printf("Total GC Pause: %v\n", stats.PauseTotalNs)
}
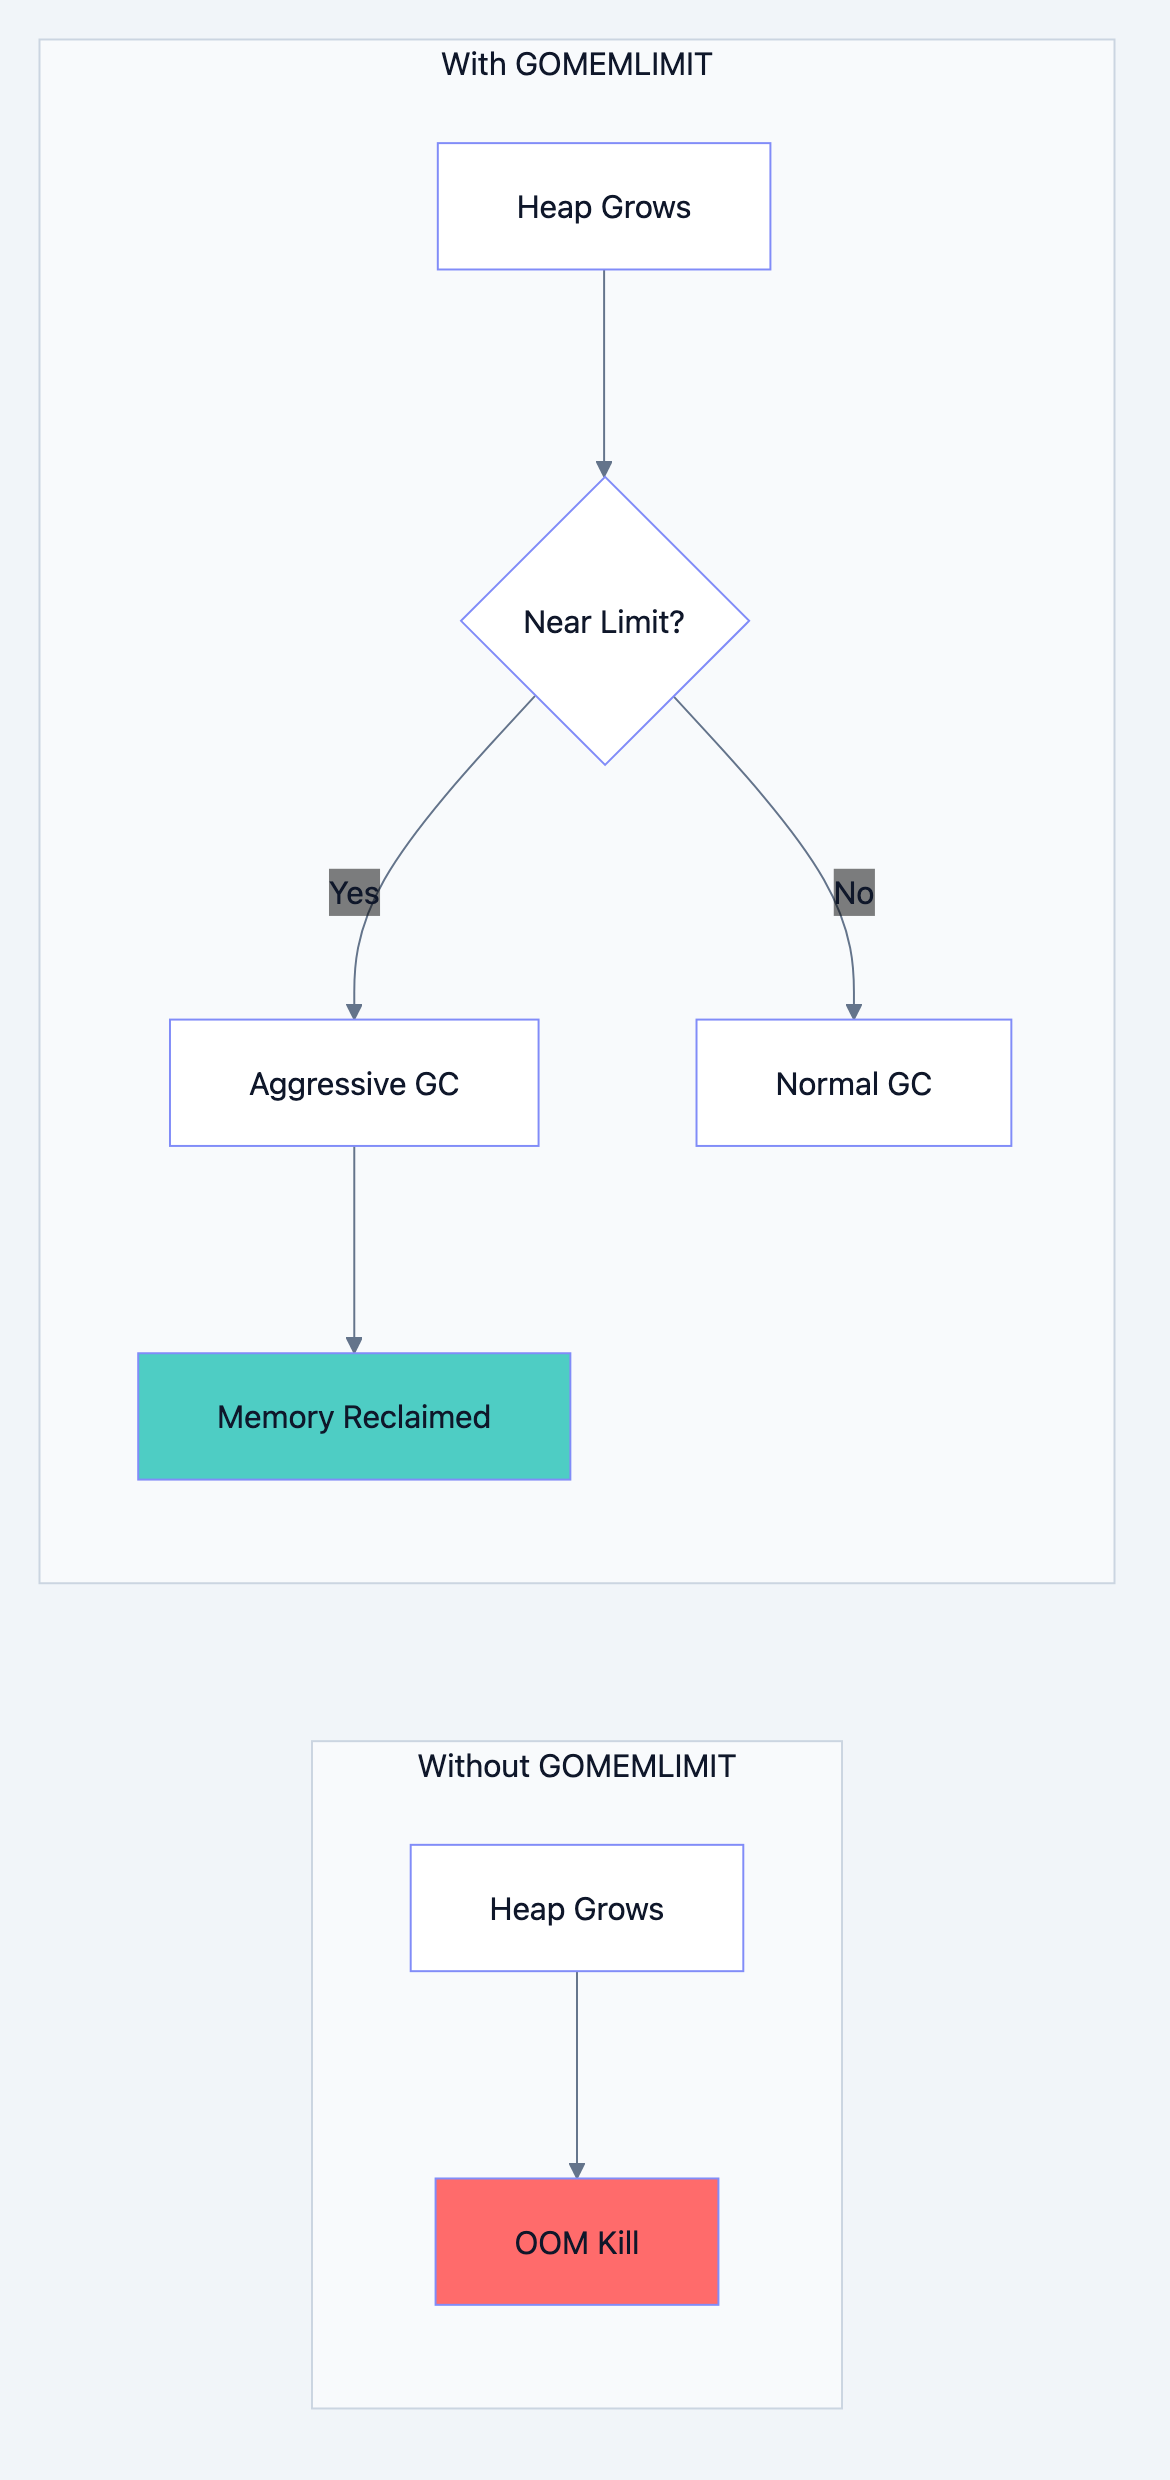
GOMEMLIMIT: Soft Memory Limit (Go 1.19+)
Go 1.19 introduced
GOMEMLIMIT, a soft memory limit that prevents OOM (out of memory) kills:go// Set soft limit to 1GB debug.SetMemoryLimit(1 << 30) // 1GB in bytes // Or via environment variable: // GOMEMLIMIT=1GiB ./myapp
When approaching the limit, Go runs GC more aggressively. This is particularly useful in containerized environments with hard memory limits.
How GOMEMLIMIT changes behavior:
Without limit:
- Heap grows based on GOGC
- OOM if container limit exceeded
With limit:
- GC runs more frequently as heap approaches limit
- Graceful degradation instead of OOM kill
Writing GC-Friendly Code
Reduce Allocations
Every allocation creates work for the GC. Fewer allocations = less GC pressure.
Pattern: Pre-allocate slices
go// INEFFICIENT: Grows and reallocates repeatedly
func buildSliceBad(n int) []int {
    var result []int
    for i := 0; i < n; i++ {
        result = append(result, i)  // May reallocate each time
    }
    return result
}

// EFFICIENT: Single allocation
func buildSliceGood(n int) []int {
    result := make([]int, 0, n)  // Pre-allocate capacity
    for i := 0; i < n; i++ {
        result = append(result, i)  // No reallocation
    }
    return result
}
Pattern: Use strings.Builder
go// INEFFICIENT: Creates new string each iteration
func concatBad(parts []string) string {
    result := ""
    for _, p := range parts {
        result += p  // Allocates new string each time!
    }
    return result
}

// EFFICIENT: Minimizes allocations
func concatGood(parts []string) string {
    var builder strings.Builder
    for _, p := range parts {
        builder.WriteString(p)  // Appends in place
    }
    return builder.String()
}
Use sync.Pool for Temporary Objects
Reuse expensive temporary objects instead of creating new ones:
go// Filename: pool_usage.go
package main

import (
    "bytes"
    "sync"
)

var bufferPool = sync.Pool{
    New: func() interface{} {
        return new(bytes.Buffer)
    },
}

func processRequest(data []byte) string {
    // Get buffer from pool (or create new if empty)
    buf := bufferPool.Get().(*bytes.Buffer)
    buf.Reset()  // Clear previous contents

    // Use buffer
    buf.Write(data)
    result := buf.String()

    // Return to pool for reuse
    bufferPool.Put(buf)

    return result
}
Minimize Pointer Density
The GC must trace every pointer. More pointers = more work.
go// HIGH GC OVERHEAD: Many pointers to trace
type BadStruct struct {
    Name    *string
    Age     *int
    Active  *bool
    Created *time.Time
}

// LOW GC OVERHEAD: Values instead of pointers
type GoodStruct struct {
    Name    string
    Age     int
    Active  bool
    Created time.Time
}
Only use pointers when necessary (shared references, optional fields, large values).
Understand Escape Analysis
Go's compiler decides whether variables live on the stack (cheap) or heap (requires GC):
- Stack: Automatic cleanup when function returns no GC involvement
- Heap: Tracked by GC, more expensive
go// Likely heap allocation (escapes to caller)
func newUserHeap() *User {
    u := User{Name: "Alice"}
    return &u  // Pointer escapes function
}

// Likely stack allocation (no escape)
func useUserStack() string {
    u := User{Name: "Bob"}
    return u.Name  // Only value escapes, struct stays on stack
}
Analyze with:
bashgo build -gcflags="-m" main.go
# Output shows escape analysis decisions
Monitoring GC Performance
Runtime Memory Statistics
go// Filename: gc_monitoring.go
package main

import (
    "fmt"
    "runtime"
    "time"
)

func printGCStats() {
    var stats runtime.MemStats
    runtime.ReadMemStats(&stats)

    fmt.Printf("=== Memory Statistics ===\n")
    fmt.Printf("Heap Allocated:   %d MB\n", stats.HeapAlloc/1024/1024)
    fmt.Printf("Heap System:      %d MB\n", stats.HeapSys/1024/1024)
    fmt.Printf("Heap Objects:     %d\n", stats.HeapObjects)
    fmt.Printf("GC Cycles:        %d\n", stats.NumGC)
    fmt.Printf("Last GC Pause:    %v\n", time.Duration(stats.PauseNs[(stats.NumGC+255)%256]))
    fmt.Printf("Total GC Pause:   %v\n", time.Duration(stats.PauseTotalNs))
    fmt.Printf("GC CPU Fraction:  %.2f%%\n", stats.GCCPUFraction*100)
}

func main() {
    printGCStats()
}
GODEBUG Environment Variable
Enable GC tracing for detailed insights:
GODEBUG=gctrace=1 ./myappSample output:
gc 1 @0.012s 2%: 0.018+1.2+0.003 ms clock, 0.14+0.52/1.8/0+0.024 ms cpu, 4->4->1 MB, 5 MB goal, 8 P
Breakdown:
gc 1: GC cycle number@0.012s: Time since program start2%: Percentage of CPU used by GC0.018+1.2+0.003 ms: STW pause + concurrent + STW pause4->4->1 MB: Heap before → after → live data5 MB goal: Target heap size8 P: Number of processors
GC Tuning Strategies
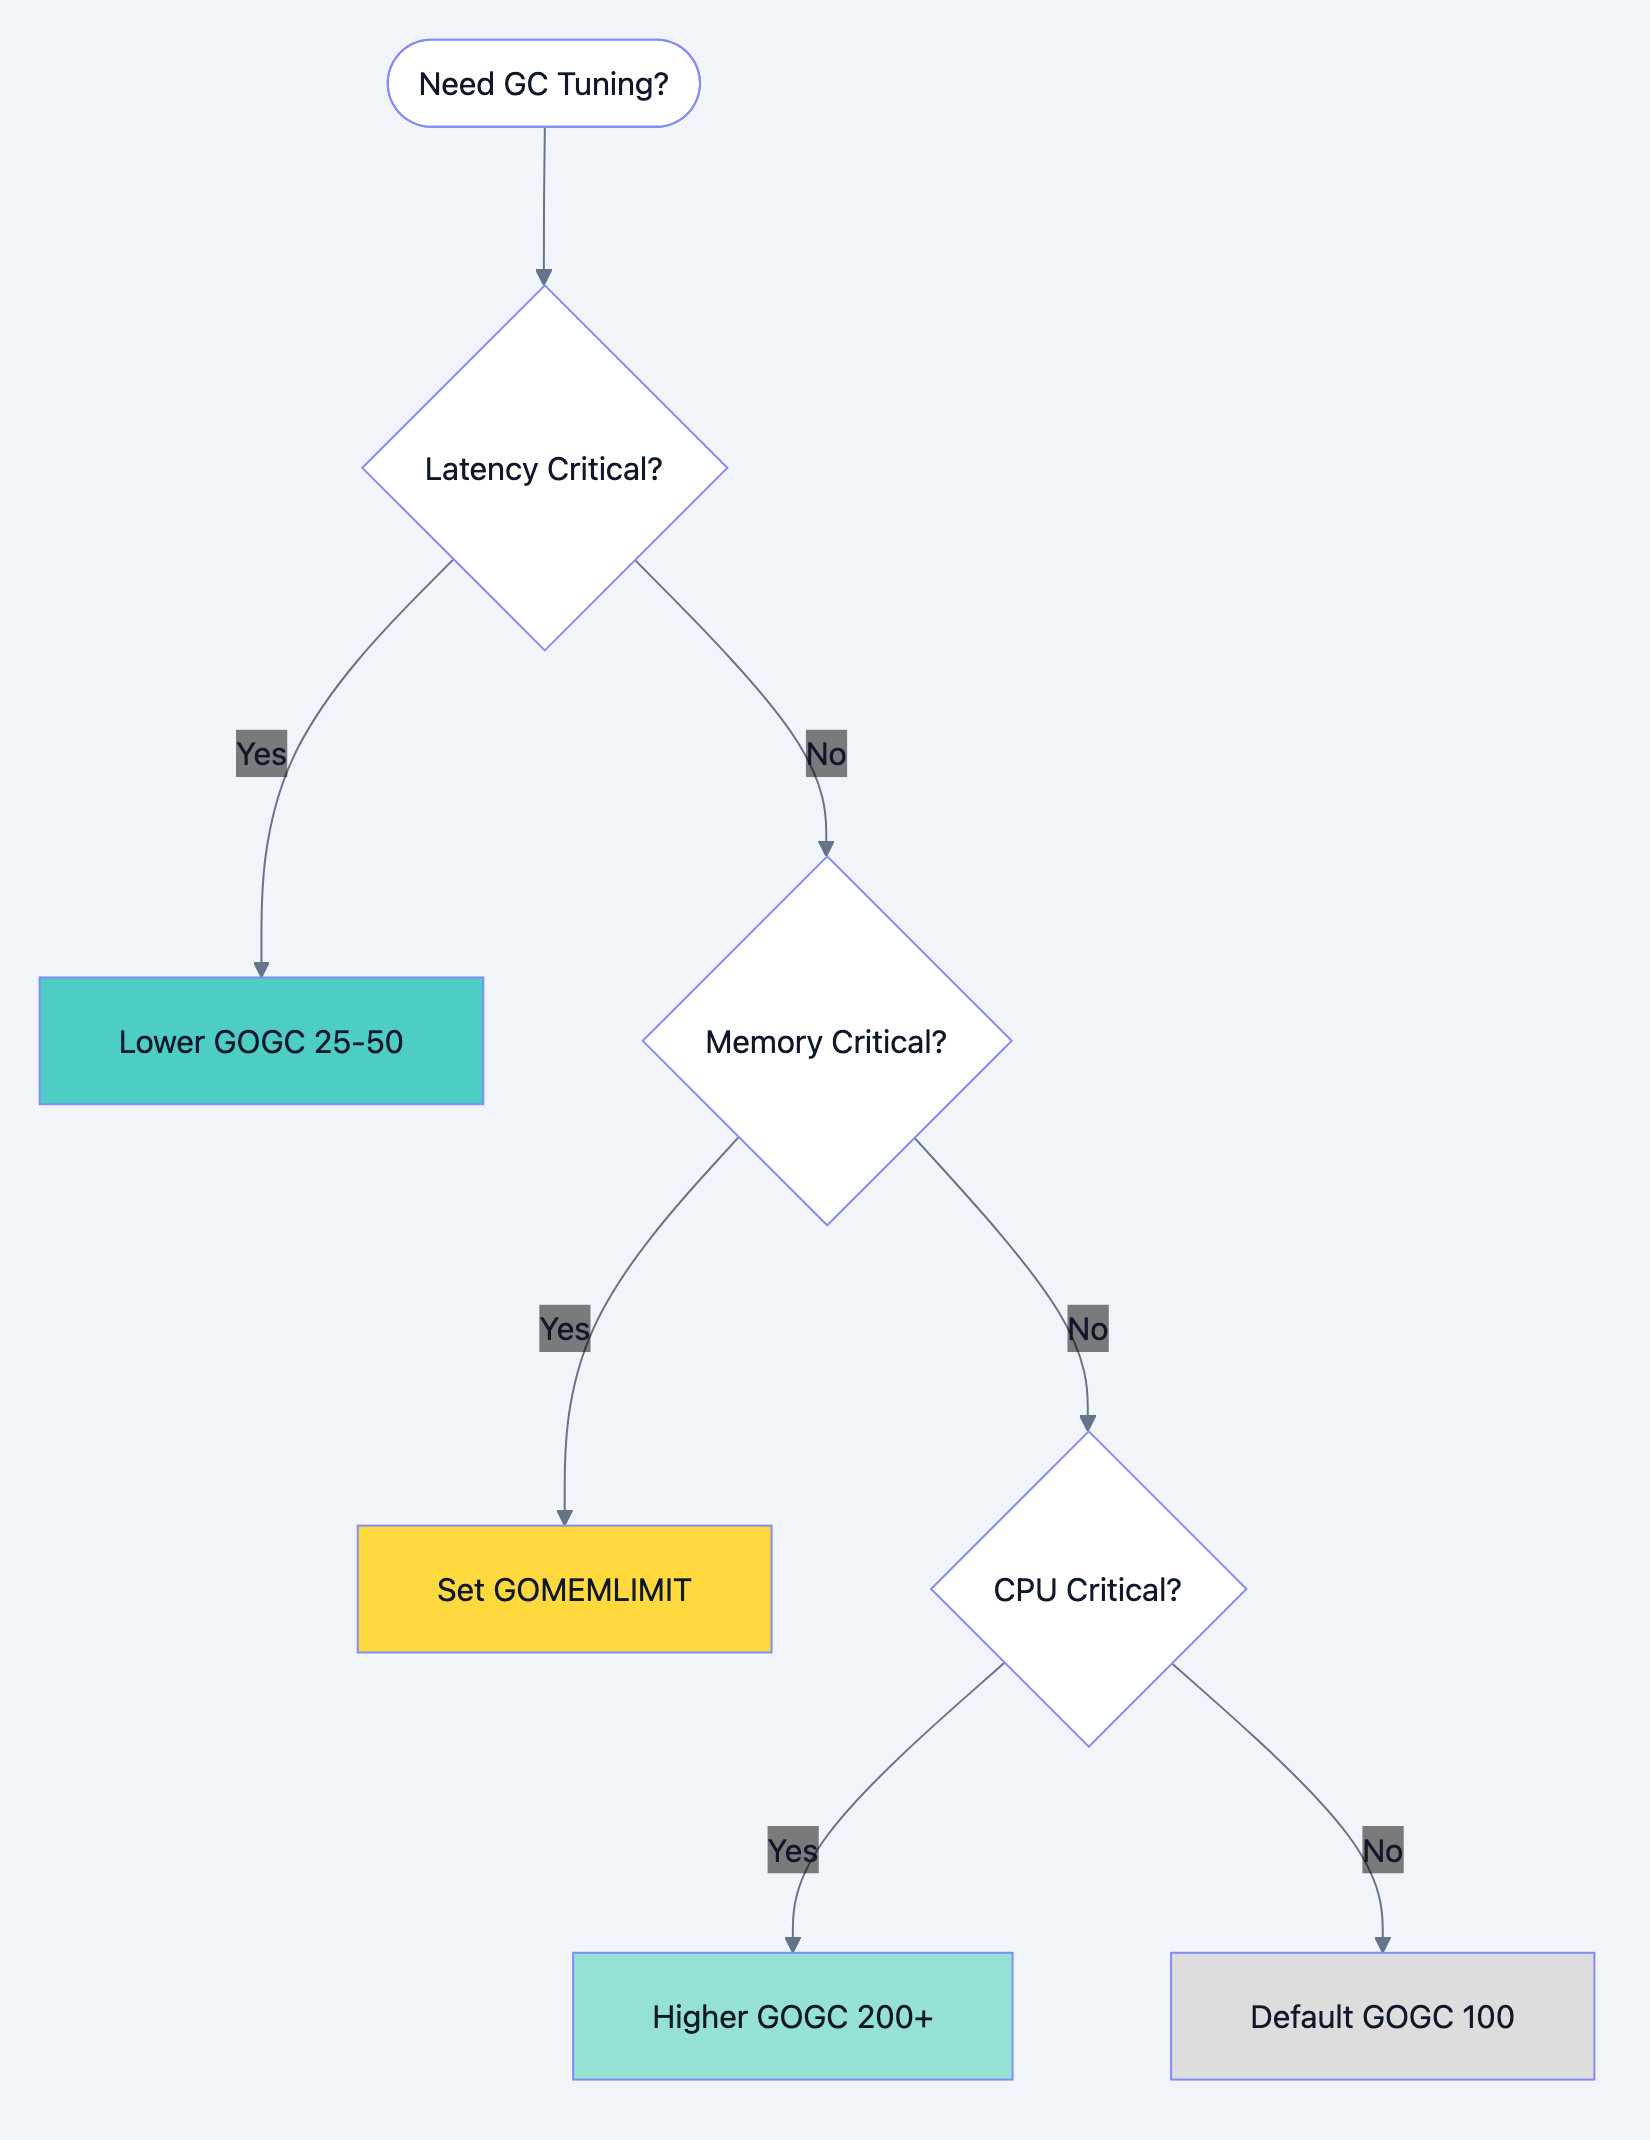
Go blog diagram 7
By Workload Type
| Workload | GOGC | GOMEMLIMIT | Rationale |
|---|---|---|---|
| Latency-sensitive (API) | 25-50 | Set based on container | Frequent, smaller pauses |
| Throughput-focused (batch) | 200-400 | High | Minimize GC interruptions |
| Memory-constrained | 100 | Set to limit | Balance within constraints |
| Burst processing | 400+ | High | Let heap grow, GC between bursts |
Practical Guidelines
- Start with defaults: GOGC=100 works well for most applications
- Measure before tuning: Use profiling, not intuition
- Set GOMEMLIMIT in containers: Prevents OOM kills
- Monitor GC metrics: Track pause times, frequency, CPU usage
- Avoid forcing GC:
runtime.GC()is rarely helpful
Common Mistakes and Misconceptions
Mistake 1: Manually Calling runtime.GC()
go// WRONG: Forcing GC rarely helps
func processRequest() {
    // do work
    runtime.GC()  // Wastes CPU, doesn't improve anything
}

// RIGHT: Trust the automatic GC
func processRequest() {
    // do work
    // GC runs when it determines it's needed
}
Mistake 2: Thinking More Goroutines = More GC Problems
Goroutines themselves are cheap (~2KB stack). The allocations within goroutines cause GC work. 10,000 goroutines doing no allocations create less GC pressure than 10 goroutines allocating heavily.
Mistake 3: Expecting Seconds-Long Pauses
Modern Go (1.5+) has sub-millisecond pauses. If you're seeing long pauses, investigate:
- Huge heap with many pointers
- Finalizers blocking collection
- Non-GC issues (OS memory pressure, CPU contention)
Mistake 4: Over-Tuning
Don't tune GOGC/GOMEMLIMIT without measurement. Profile first, tune second, measure results.
Summary
Key takeaways from this chapter:
-
Go's GC is concurrent: Most work happens alongside your program
-
Tricolor marking identifies live objects: White (garbage), gray (pending), black (live)
-
STW pauses are brief: Typically under 1ms
-
GOGC controls frequency: Higher = less frequent, more memory; lower = opposite
-
GOMEMLIMIT prevents OOM: Soft limit triggers aggressive GC near threshold
-
Reduce allocations: Fewer allocations mean less GC work
-
Reuse objects with sync.Pool: Avoids repeated allocation/deallocation
-
Minimize pointer density: Fewer pointers = less tracing work
-
Stack vs heap: Escape analysis determines; stack is cheaper
Interview Questions
-
Explain Go's tricolor mark-and-sweep algorithm. What do the three colors represent?
-
What are the main phases of Go's garbage collection cycle? Which are stop-the-world?
-
How does the GOGC environment variable affect garbage collection behavior? What are the trade-offs of different values?
-
Explain the purpose of GOMEMLIMIT introduced in Go 1.19. When would you use it?
-
What is a "write barrier" and why does Go's GC need one?
-
Describe the difference between stack allocation and heap allocation. How does escape analysis determine which is used?
-
Why might calling
runtime.GC()explicitly hurt performance rather than help? -
How does sync.Pool help reduce GC pressure? What happens to pooled objects during GC?
-
A service's memory usage keeps growing even though pprof shows no obvious leaks. What GC-related causes would you investigate?
-
Explain the trade-off between GC pause time and GC CPU overhead.
-
How would you diagnose excessive GC overhead in a production service?
-
What's the relationship between pointer density in data structures and GC performance?
-
Why is pre-allocating slice capacity better than growing slices incrementally?
-
Describe how Go's concurrent GC maintains correctness while the application modifies memory.
-
How does containerization (Docker/Kubernetes) affect GC tuning decisions?